Double Bottom Pattern: How to Identify It, Confirm It, and Measure It
A double bottom is two lows at roughly the same level with a rally between them, traditionally read as a bullish reversal once price breaks above the rally's high. Here's how it works and where it fails.
A double bottom is a chart pattern in which price falls to a low, rallies, falls again to about the same low, and then rises. It's traditionally read as a possible bullish reversal, shaped like the letter "W."
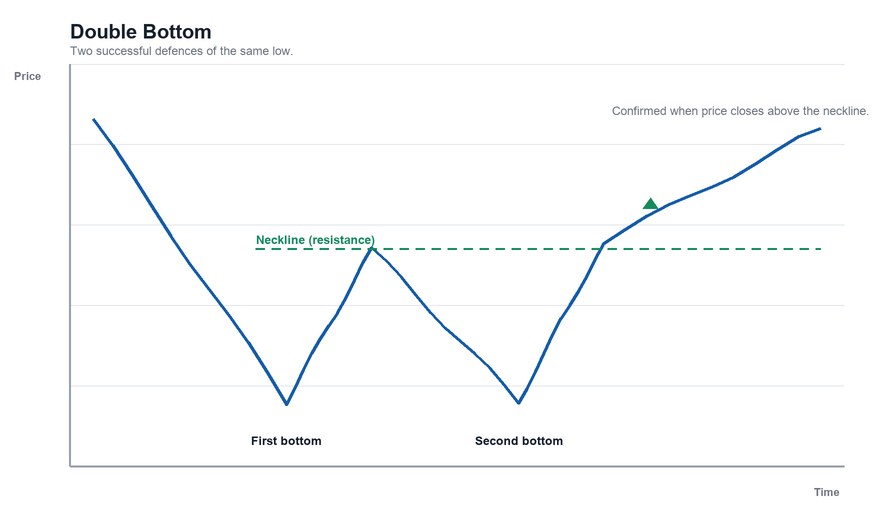
The Structure
- A prior downtrend. There has to be a decline to reverse.
- First low. Price falls to a low and bounces.
- The rally high. The peak of the bounce. A horizontal line through it is the pattern's resistance (the neckline).
- Second low. Price falls back to roughly the same level, but doesn't make a meaningfully lower low.
- Confirmation. Price closes above the rally high.
How close the two lows need to be is a judgment call; a few percent is a common guideline, not a rule.
Why It's Read as Bullish
The traditional logic is a floor holding twice. Sellers pushed price to the same level two times and could not go lower; buyers showed up both times. When price breaks above the high between the lows, sellers who were waiting for a bounce to exit are considered to have lost control, and buyers have pushed past resistance.
Confirmation
The pattern is not complete until price breaks above the neckline. Until then, the second low could simply be the start of a further decline. Typical conditions:
- A close above the neckline, not just an intraday spike.
- Volume expanding on the breakout. See what volume confirms a breakout.
- Sometimes a retest in which price falls back to the neckline and holds it as support.
In the textbook description, volume is lower on the second low than the first, suggesting selling pressure is fading.
The Traditional Price Target
- Measure the vertical distance from the lows to the neckline.
- Project that distance upward from the breakout.
Example. Lows at $40, neckline at $48 (height $8). Price breaks above $48. Measured target: $48 + $8 = $56.
It's a convention, not a prediction. See how to measure a price target.
Variations and Related Patterns
- Triple bottom. A third test of the same floor makes it a triple bottom.
- Rounding bottom. A smoother, slower base without distinct lows; see the rounding bottom.
- Unequal lows. If the second low is slightly higher than the first, it's sometimes taken as a sign of stronger demand. If it's slightly lower, some still count the pattern; there's no standard.
How It Fails
- The floor breaks. Price falls through the lows on the second or later test, invalidating the pattern.
- Fakeouts. A close above the neckline can reverse quickly. See false breakouts.
- It's hard to spot early. A bounce from a first low looks the same as any other bounce until the second low forms.
- Long and slow. The pattern may span weeks to months on a daily chart, and the signal arrives after much of the rebound.
- Timeframe. Meaning depends on the chart. See timeframes.
The mirror image is the double top, and our double top vs. double bottom guide compares the two. For the research on whether patterns work, see do chart patterns actually work.
This article is for educational purposes only and is not investment advice.
Find out what we're watching before the market opens
Every day we send a free breakdown of the signals, setups, and stocks getting institutional attention. No paid subscription. No upsell. Just the signal.
Get the Next Alert →