What Is a False Breakout? Why Breakouts Fail and How Traders Define It
A false breakout is a move through a key level that reverses back inside it. They're a normal part of markets, not an anomaly. Here's how they're defined, why they happen, and what traders look at to filter them.
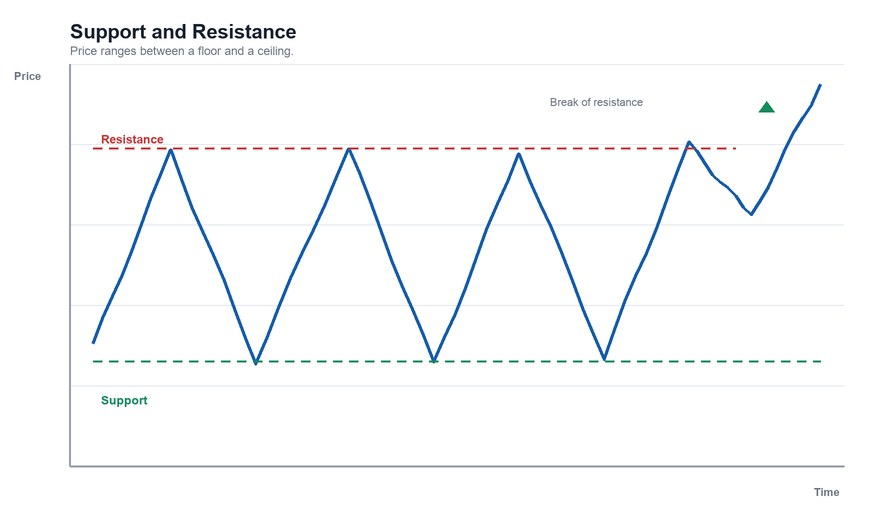
A false breakout (also called a fakeout) happens when price moves beyond a well-defined level — a resistance line, a support line, a pattern boundary — and then reverses back inside the prior range instead of continuing. The breakout "failed."
There is no standard definition of how far, how long, or on what volume a move has to be before it counts, which is part of why the topic generates so much argument. What's well established is that false breakouts are common, and any approach to trading breakouts has to account for them.
Why Breakouts Fail
Several mechanisms are commonly cited:
- Stop-order clusters. Many participants place stop orders just beyond obvious levels. A brief push through the level can trigger those orders, producing a short burst of movement that fades once the orders are filled.
- Lack of follow-through demand. A breakout needs sustained buying (or selling) to hold. If the initial push attracted no additional participants, price can drift back.
- Thin trading conditions. Low volume, such as around holidays or outside regular hours, means fewer orders can move the price through a level.
- News and one-off events. A headline can spike price through a level briefly, and the spike fades as the information is absorbed.
- Too many people watching the same level. If a level is widely followed, early positioning can pull the move forward and leave nothing for the real breakout.
None of these is a law. They're explanations for why a pattern that looks valid at the time can fail.
How Traders Try to Filter Them
Because no filter eliminates false breakouts, these are tradeoffs, not solutions.
1. Wait for a close beyond the level. Rather than treating an intraday push as a breakout, many people require the closing price to be beyond the level. This filters out brief wicks, at the cost of a later (often worse) entry.
2. Require a minimum distance. Some use a buffer — a small percentage or a multiple of recent volatility — beyond the level before calling it a breakout.
3. Look at volume. A breakout on heavy volume relative to average is considered more credible. See what volume confirms a breakout for how that's measured and where it falls short.
4. Wait for multiple closes. Requiring two or three consecutive closes beyond the level reduces false signals further and delays the signal further.
5. Wait for a retest. After a breakout, price often returns to the broken level. If the old resistance holds as new support, the breakout is described as confirmed. The cost: some breakouts never retest, and the opportunity can be missed.
Every filter trades false signals for lateness. Stricter filters avoid more fakeouts but also enter later or miss real moves entirely.
How Often Do They Happen?
There's no single reliable number. The frequency of failure varies by market, time frame, pattern definition, and the filter used, and published percentages differ widely depending on how "false" is defined. A fair statement is that failures are frequent enough that it's normal for a meaningful share of breakouts to fail. Treat any specific percentage with caution unless you can see how it was measured. The broader question of whether patterns have predictive value is covered in do chart patterns actually work.
A Worked Example
A stock has repeatedly stalled at $50. On Tuesday it trades as high as $50.60 intraday but closes at $49.70. On Wednesday it opens at $49.90 and trades lower.
- Under a close-based rule, Tuesday was never a breakout, since it did not close above $50.
- Under an intraday rule, it was a breakout that failed.
- Someone who bought at $50.10 on Tuesday on a stop order is now sitting on a loss — which is the definition of how stop-triggered fakeouts hurt.
Planning for Failure
Since false breakouts are expected, the practical question is usually not "how do I avoid them?" but "what happens if this one fails?" Many traders define in advance the level at which a breakout is considered invalid — often just back inside the prior range — so a failure is a small, planned loss rather than an open-ended one. That is a risk-management concept rather than a prediction technique, and it is what makes the pattern vocabulary in guides to flags and pennants or triangles practically useful.
This article is for educational purposes only and is not investment advice.
Find out what we're watching before the market opens
Every day we send a free breakdown of the signals, setups, and stocks getting institutional attention. No paid subscription. No upsell. Just the signal.
Get the Next Alert →