Rounding Bottom Pattern: What It Is and How It Differs From a Cup and Handle
A rounding bottom, or saucer, is a slow, gradual turn from a downtrend to an uptrend. Here's how it's identified and how it differs from a cup and handle.
A rounding bottom, also called a saucer bottom, is a chart pattern in which price declines gradually, flattens out, and then rises just as gradually, tracing a smooth "U" shape. It is one of the slowest-forming patterns in technical analysis and is traditionally read as a gradual shift in control from sellers to buyers.
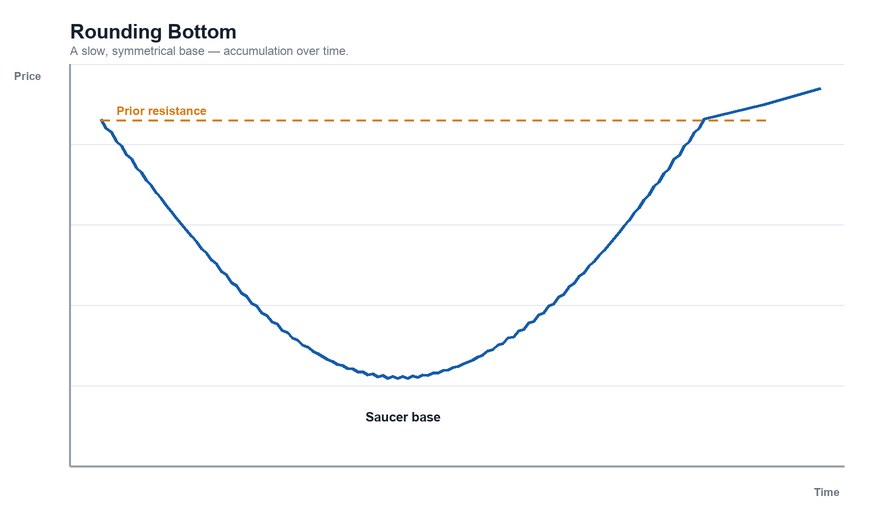
What the Pattern Looks Like
The pattern has three phases:
- The decline. Price drifts lower. The decline slows over time rather than ending abruptly — the downward slope gets shallower.
- The base. Price trades sideways near the low for a while, with little directional conviction.
- The recovery. Price begins to rise slowly, then the upward slope gradually steepens, heading back toward the level where the decline began.
The key visual feature is the smoothness. There are no sharp V-shaped reversals; the change in direction happens gradually, which is why the pattern is described as "rounded."
The Story Behind It
The traditional interpretation is about the gradual exhaustion of selling. Early in the decline, sellers are in control. As the price falls, fewer holders are willing to sell at lower prices, so the decline loses momentum. Eventually buyers begin to accumulate, and a slow shift in the balance produces the rounded recovery.
Volume is often described as following the same shape: heavier during the decline, lighter near the bottom, and increasing again on the way up. Treat that as a typical description, not a requirement, since real volume is noisy.
How Long It Takes
Rounding bottoms are generally long formations, often spanning many weeks to many months. The slow pace is part of what defines the pattern, and also what makes it hard to identify in real time: a long, shallow decline followed by a quiet base only looks like a rounding bottom in hindsight.
Rounding Bottom vs. Cup and Handle
The two are close relatives and are frequently confused.
| Rounding bottom | Cup and handle | |
|---|---|---|
| Shape | Smooth U, no handle | U-shaped cup plus a small pullback (the handle) |
| Typical context | Reversal after a decline | Often described as a base inside a longer uptrend |
| Handle | None | Yes — a shallow pullback near the rim |
| Time frame | Often long | Weeks to months |
| Confirmation | Price recovering through the prior resistance | Break above the rim or the handle's high |
The shorthand: a cup and handle is a rounding bottom with an extra step. After the rounded recovery, a cup and handle pauses and pulls back slightly (the handle) before the breakout, which is read as a final shakeout of holders who were waiting to break even. A rounding bottom has no such pause.
Our full guide to the cup and handle pattern covers the handle criteria in detail.
Confirmation and Targets
The pattern is generally considered confirmed when price rises through the resistance level formed by the start of the decline — shown as the dashed line in the chart above. Some traders measure the depth of the "saucer" (resistance minus the low) and project that distance upward from the breakout as a rough illustration of a possible target. This is a convention, not a forecast.
Honest Limitations
- It is easy to see only in hindsight. Almost any long decline followed by a recovery can be described as a rounding bottom after the fact.
- A rounded shape can stall. Price can recover partway and roll over again, never reaching the resistance.
- It depends on the scale. On a logarithmic versus linear chart, the same price history can look more or less rounded.
- The pattern says nothing about why price turned. A recovery driven by improving business conditions and one driven by short-term sentiment look the same on a chart.
The Bottom Line
A rounding bottom is a slow, gradual transition from a downtrend to an uptrend, shaped like a saucer. It is closely related to the cup and handle but lacks the handle, and it forms over a longer and quieter stretch. Like every pattern, it describes what price has done, and confirmation only comes when resistance is actually recovered.
This article is for educational purposes only and is not investment advice.
Find out what we're watching before the market opens
Every day we send a free breakdown of the signals, setups, and stocks getting institutional attention. No paid subscription. No upsell. Just the signal.
Get the Next Alert →