Triple Bottom Pattern: How to Identify It, Confirm It, and Where It Fails
A triple bottom is three lows at about the same level with two rallies between them, traditionally read as a bullish reversal. Here's how it's confirmed and measured.
A triple bottom is a chart pattern in which price falls to roughly the same low three times, with a rally between each, and is then traditionally read as a bullish reversal if price breaks out above the pattern's resistance.
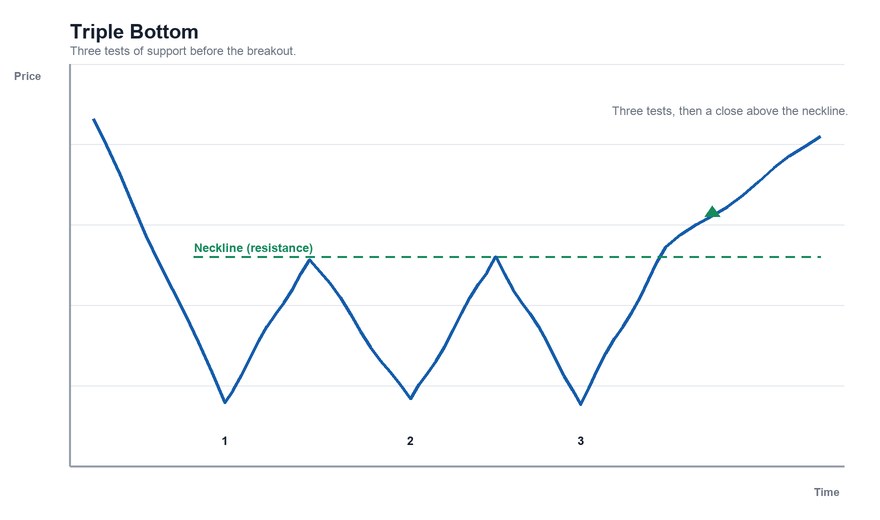
The Structure
The pattern needs:
- A prior downtrend. Without something to reverse, there's no reversal pattern.
- Three lows at approximately the same price, each followed by a rally. They don't have to be identical; a small band is normal.
- Two rally highs between the lows, at roughly similar levels. A line connecting them forms the resistance level.
- A breakout: price closes above that resistance.
Time between the lows is commonly weeks to months on a daily chart, and the whole pattern often takes several months.
Why It's Read as Bullish
The traditional logic is about a floor holding. Price falls to the same level three times and buyers step in each time, showing that sellers can't push it lower. Each failed attempt is seen as exhausting selling pressure. When price finally rallies through the resistance above, buyers are considered to be in control.
Confirmation
The pattern is generally not complete until price breaks above the resistance level that connects the rally highs. Before that, it's just three dips. Common conditions:
- A close above the resistance, not just an intraday spike.
- Volume expanding on the breakout. See what volume confirms a breakout.
- Often, a retest in which price returns to the broken level and holds it.
Volume is often described as declining across the three lows (selling interest fading) and rising on the breakout.
The Traditional Price Target
The measured-move convention:
- Measure the vertical distance from the lows to the resistance line.
- Project that distance upward from the breakout.
Example. The three lows are at $40 and the rally highs at $48 (height $8). Price breaks above $48. Measured target: $48 + $8 = $56.
It's a reference, not a forecast; see how to measure a price target.
Triple Bottom vs. Double Bottom
| Double bottom | Triple bottom | |
|---|---|---|
| Number of lows | 2 | 3 |
| Rallies between | 1 | 2 |
| Typical duration | Shorter | Longer |
| Traditional view | Bullish reversal | Same, with the extra test often seen as a stronger floor |
The extra test is why some describe a triple bottom as more significant. Our guide to double tops and bottoms and the triple top vs. triple bottom comparison cover the other patterns.
The Caveat: A Third Test Can Mean the Opposite
Every time a support level is tested, it's possible that it breaks. A floor that holds twice can fail on the third test, and repeated tests are sometimes read as weakening support rather than strengthening it: each test uses up the buyers waiting at that level. A break below the lows then invalidates the pattern, and the level that was support becomes resistance.
That's why the pattern is only meaningful after the breakout, and why a defined invalidation point (a close below the lows) matters.
Limits
- Hard to spot in real time. You only know it's a triple bottom after the third low and the breakout.
- Fakeouts. A breakout above resistance can reverse; see false breakouts.
- Subjective. How close the three lows must be is a matter of judgment.
- Rare. True triple bottoms are less common than double bottoms, so there's less to go on.
- Mixed evidence. See do chart patterns actually work.
This article is for educational purposes only and is not investment advice.
Find out what we're watching before the market opens
Every day we send a free breakdown of the signals, setups, and stocks getting institutional attention. No paid subscription. No upsell. Just the signal.
Get the Next Alert →