What Volume Confirms a Breakout? How Traders Read Volume at Key Levels
A breakout on thin volume is often treated with suspicion, while one on heavy volume gets more attention. Here's how volume is measured against a baseline, what 'confirmation' means, and where the rule of thumb falls short.
When price moves above a resistance level or out of a chart pattern, a common follow-up question is: was there volume behind it? The rule of thumb is that a breakout on strong volume is more credible than one on weak volume. This article explains the logic, how people measure "strong," and where the rule breaks down.
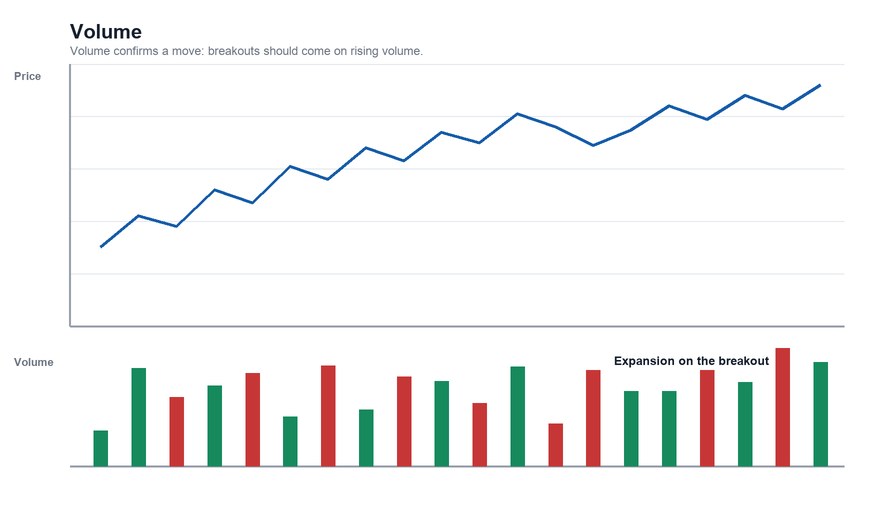
Why Volume Is Used
Price tells you where trades happened. Volume tells you how many shares changed hands. The logic of volume confirmation is about participation:
- A move on heavy volume means many participants were willing to trade at the new prices. That is read as broad conviction.
- A move on light volume means few participants were involved, so a small number of orders may have moved the price. That is read as less conviction, and the move is more likely to reverse.
Volume is not a measure of whether buyers or sellers "won" — every share bought is also sold. It's a measure of how much activity there was.
How "Strong Volume" Is Measured
Volume has no absolute threshold. A million shares is heavy for one stock and trivial for another. So volume is judged relative to a baseline, most commonly:
- Average volume over a recent window (such as 20 or 50 days). A breakout bar can be compared to this average, often expressed as a ratio: 1.0x is normal, 2.0x is double the average.
- The volume of the pattern itself. Many patterns have an expected volume profile — for example, volume shrinking during a triangle or a flag's consolidation, then expanding on the breakout.
There isn't a universally accepted cutoff. Some traders look for volume well above average — figures like 40–50% above average are sometimes mentioned in the investing literature — but these are rules of thumb, not tested thresholds, and different sources use different numbers.
The Typical Volume Pattern for a Valid Breakout
Textbook descriptions of the idealized sequence:
- During the pattern, volume tends to be subdued as price consolidates.
- On the breakout, volume expands noticeably.
- After the breakout, a retest of the broken level on lighter volume is often described as healthy.
You can see versions of this described for the cup and handle, the bull flag, and the head and shoulders, where volume is commonly described as expanding on the neckline break.
A Practical Example
Say a stock has averaged 2 million shares a day over the last 50 days and closes above a resistance level that had capped it for three months.
- If that day's volume is 5 million, it's 2.5x average: participation was heavy, and the breakout is described as "confirmed by volume."
- If volume is 1.4 million, it's 0.7x average: the breakout is described as "unconfirmed," and traders often wait for follow-through before treating it as meaningful.
Where the Rule Falls Short
- Heavy volume doesn't guarantee follow-through. High-volume breakouts fail too, especially when the volume reflects a news event or index-related trading rather than organic buying.
- Light-volume breakouts sometimes work. Low-volume periods, such as around holidays, can distort the comparison.
- Volume varies by time of day and day of week. Comparing a partial-day volume reading to a full-day average gives a misleading ratio. Many people wait for the close.
- Volume data differs by source. Consolidated vs. single-exchange volume, and volume in different trading venues, can give different numbers.
- Intraday vs. daily. A volume rule built for daily charts doesn't automatically carry over to a 5-minute chart.
- It's an input, not a verdict. Volume is one piece of evidence, and the research on how well it improves breakout outcomes is mixed. See do chart patterns actually work for the broader picture.
What Volume Can and Can't Tell You
Volume can tell you whether a move had broad participation. It can't tell you why people traded, whether they'll keep doing so, or whether the breakout will hold. Pairing it with the level that was broken — see false breakouts and support and resistance — gives a more complete picture than volume alone.
This article is for educational purposes only and is not investment advice.
Find out what we're watching before the market opens
Every day we send a free breakdown of the signals, setups, and stocks getting institutional attention. No paid subscription. No upsell. Just the signal.
Get the Next Alert →