Double Top Pattern: How to Identify It, Confirm It, and Measure It
A double top is two peaks at roughly the same level with a dip between them, traditionally read as a bearish reversal once price breaks the dip's low. Here's how it's confirmed and where it fails.
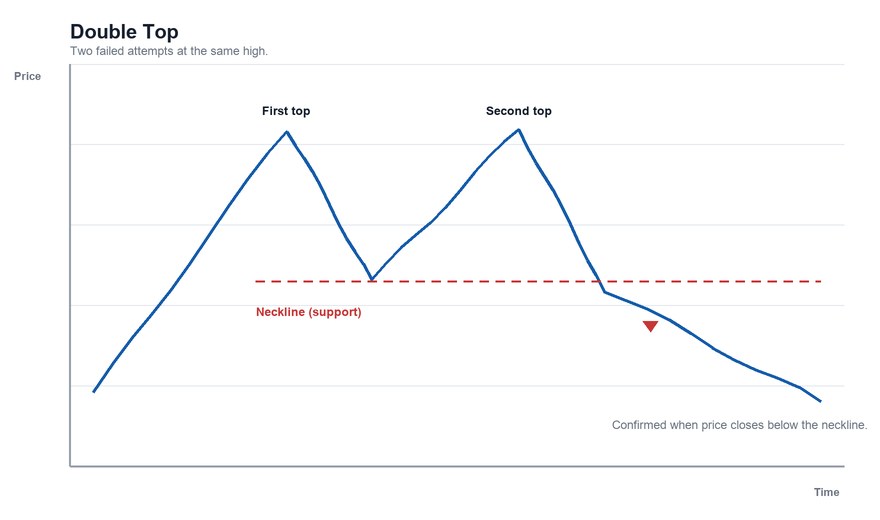
A double top is a chart pattern in which price rises to a peak, pulls back, rises to a second peak at about the same level, and then falls. It's traditionally read as a possible bearish reversal, shaped like the letter "M."
The Structure
- A prior uptrend. The pattern is a reversal, so there has to be a trend to reverse.
- First peak. Price rises to a high and then pulls back.
- The trough. The low of the pullback. A horizontal line through it is the pattern's support (sometimes called the neckline).
- Second peak. Price rallies again to roughly the same high, but fails to break through.
- Confirmation. Price closes below the trough's low.
How close the two peaks need to be is a judgment call. A common guideline is that they should be within a few percent of each other, but there's no standard.
Why It's Read as Bearish
The traditional reading is that sellers defended the same price twice. The first peak shows buyers running out of strength; the second shows they tried again and failed at the same ceiling. Once price breaks below the trough, the buyers who bought near the highs are underwater, and the support level is gone.
Confirmation Matters
A double top is not complete until price breaks the trough support. Until then it's just two peaks, and price might rally through the highs instead. Typical conditions:
- A close below the trough, not just an intraday dip.
- Volume rising on the breakdown. See what volume confirms a breakout.
- Sometimes a retest where price rebounds to the broken support and fails.
In the textbook description, volume is lighter on the second peak than the first, suggesting weaker buying.
The Traditional Price Target
- Measure the vertical distance from the peaks to the trough.
- Project that distance downward from the breakdown point.
Example. Peaks at $50, trough at $44 (height $6). Price breaks below $44. Measured target: $44 − $6 = $38.
This is a convention, not a forecast. See how to measure a price target.
Variations
- Adam and Eve tops. Some analysts distinguish a sharp, narrow first peak ("Adam") from a rounder second peak ("Eve"). The distinction is informal.
- Triple top. If price makes a third failed attempt, it becomes a triple top.
- Time between peaks. Often several weeks to months on a daily chart. Peaks only days apart are usually not treated as a meaningful pattern.
How It Fails
- Price breaks out instead. A third attempt can clear the highs and continue.
- Fakeouts. A dip below the trough can quickly reverse. See false breakouts.
- It's easy to see only in hindsight. Many pullbacks look like "the first half of a double top" and never complete.
- A shallow trough means a small measured target relative to the trading costs.
- Context. A double top on a 5-minute chart is a minor event; on a weekly chart it's a bigger one. See timeframes.
The mirror image is the double bottom, and our double top vs. double bottom guide compares them directly. For the research on whether such patterns work, see do chart patterns actually work.
This article is for educational purposes only and is not investment advice.
Find out what we're watching before the market opens
Every day we send a free breakdown of the signals, setups, and stocks getting institutional attention. No paid subscription. No upsell. Just the signal.
Get the Next Alert →