Bullish vs. Bearish Continuation Patterns: A Reference Guide
Continuation patterns are pauses inside an existing trend. Here's how flags, pennants, triangles, and rectangles are read in uptrends and downtrends, and how they differ from reversal patterns.
Chart patterns are usually sorted into two families:
- Continuation patterns: a pause inside an existing trend, after which the trend is expected (not guaranteed) to resume.
- Reversal patterns: a formation that suggests the existing trend is ending.
The distinction depends entirely on the trend that comes before the pattern. A pattern with no prior trend has nothing to continue.
Reading the Direction
The directional reading of a continuation pattern follows from the prior trend:
- A continuation pattern in an uptrend is read as bullish: the expected resolution is a breakout upward.
- The same shape in a downtrend is read as bearish: the expected resolution is a breakdown downward.
That's an expectation, not a certainty — the whole point of the pattern is that price must actually break one boundary to resolve it, and sometimes it breaks the other way.
The Main Continuation Patterns
| Pattern | Shape | In an uptrend | In a downtrend |
|---|---|---|---|
| Flag | Short parallel channel sloping against the trend | Bull flag | Bear flag |
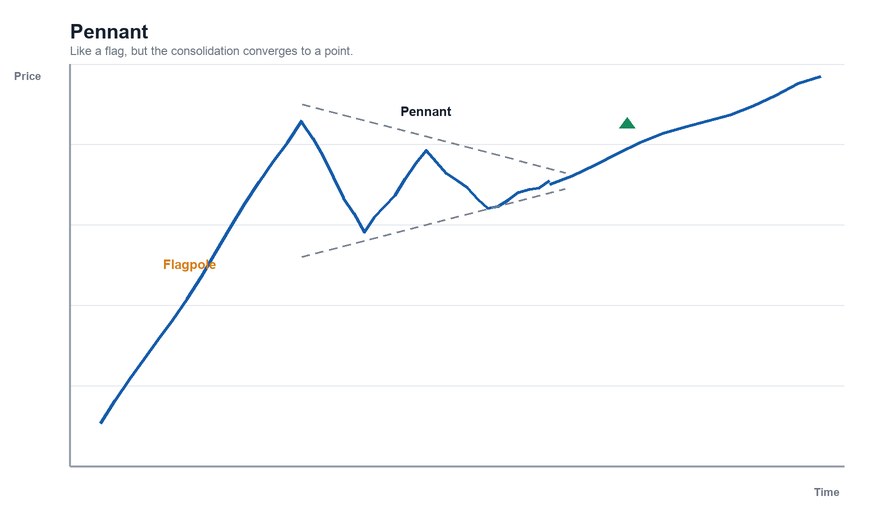
| Pennant | Small symmetrical triangle after a sharp move | Bullish pennant | Bearish pennant |
| Rectangle | Price bouncing between flat support and resistance | Bullish rectangle | Bearish rectangle |
| Ascending triangle | Flat top, rising lows | Typically read as bullish | Less common in downtrends |
| Descending triangle | Flat bottom, falling highs | Less common in uptrends | Typically read as bearish |
| Symmetrical triangle | Converging trendlines, neither flat | Direction follows prior trend | Direction follows prior trend |
Note that triangles are a gray area: ascending triangles are generally read as bullish and descending triangles as bearish regardless of the preceding trend, and they can appear as reversals as well as continuations. Symmetrical triangles are the most trend-dependent.
Continuation vs. Reversal: The Same Shapes Can Be Either
Some shapes can play both roles, which is why classification depends on context:
- A wedge can be a reversal at the end of a trend or a continuation inside one.
- A double top is usually a reversal, but a short, shallow double top within a downtrend can behave like a consolidation.
- A head and shoulders is a classic reversal, though an inverse head and shoulders appearing within an uptrend is sometimes described as a continuation.
The practical lesson is that the names are labels on top of what price did, and the more important question is where the boundary is and what happens when price crosses it.
What Continuation Patterns Have in Common
- They're relatively short compared to the trend that preceded them (the topic of how long a bull flag lasts).
- Volume typically contracts during the pause and is described as expanding on the resolution — see what volume confirms a breakout.
- They share price-target conventions. The most common approach measures the size of the prior move (or the pattern's height) and projects it from the breakout point. See how to measure a price target from a chart pattern.
Limits
- Continuation is a tendency, not a rule. A bull flag in an uptrend can break down, and the pattern then becomes the start of a reversal.
- They depend on correctly identifying the trend. If the prior trend is ambiguous, so is the pattern.
- Time frame matters. A pattern that is a continuation on a 5-minute chart may be a small part of a reversal on a daily chart. See timeframes.
- They fail. See false breakouts.
- The broader evidence is mixed. See do chart patterns actually work.
The Bottom Line
Continuation patterns are pauses; the direction they imply comes from the trend before them. Flags, pennants, rectangles, and triangles each describe a different kind of pause, and none guarantees what comes next.
This article is for educational purposes only and is not investment advice.
Find out what we're watching before the market opens
Every day we send a free breakdown of the signals, setups, and stocks getting institutional attention. No paid subscription. No upsell. Just the signal.
Get the Next Alert →