Falling Wedge and Rising Wedge Patterns: How They Form and How They're Read
Wedges slope in one direction while their boundaries converge. A falling wedge is traditionally read as bullish, a rising wedge as bearish. Here's what defines each and where the reading gets tricky.
A wedge is a chart pattern in which price moves between two trendlines that slope in the same direction and converge. That combination is what separates wedges from other shapes: a triangle has trendlines that slope in opposite directions (or one is flat), and a channel has parallel lines.
There are two kinds: the falling wedge and the rising wedge.
The Falling Wedge
In a falling wedge, price makes lower highs and lower lows, but the two trendlines converge because the downward slope of the lower line is shallower than that of the upper line. Price is still falling, but the swings are getting smaller.
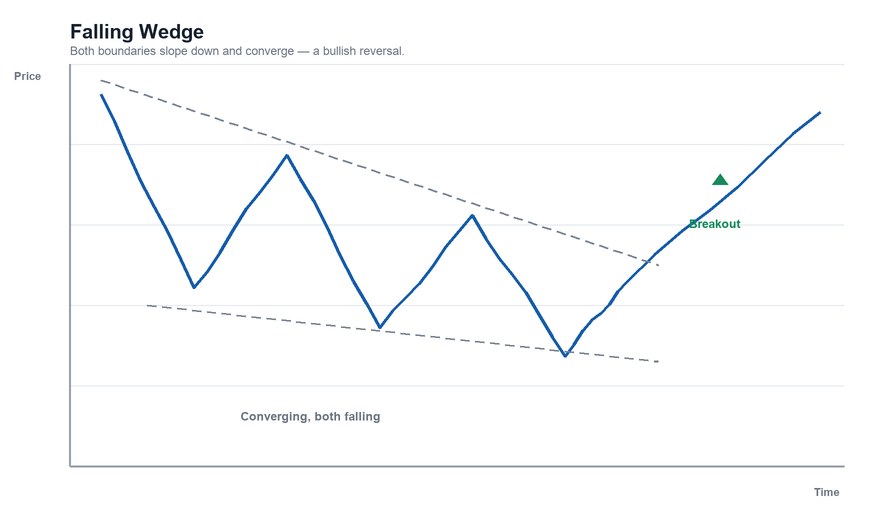
The traditional reading is bullish. The narrowing range suggests that each new low is attracting less selling pressure than the one before. The pattern is usually considered confirmed when price breaks above the upper trendline.
The Rising Wedge
A rising wedge is the mirror image: price makes higher highs and higher lows, but the lines converge because the lower trendline rises more steeply than the upper one.
The traditional reading is bearish. Price is still climbing, but each advance covers less ground, suggesting weakening buying pressure. The pattern is usually considered confirmed when price breaks below the lower trendline.
Why It's Counterintuitive
Both wedges are read as signaling the opposite of their slope: a falling pattern is read as bullish, a rising pattern as bearish. The reasoning is that the narrowing, as price moves in one direction, shows that the move is running out of energy.
Reversal or Continuation?
This is where wedges become less clear-cut. They can show up in two contexts:
- As a reversal: a falling wedge at the end of a downtrend, or a rising wedge at the end of an uptrend.
- As a continuation: a falling wedge forming as a pause within an uptrend (a counter-trend correction), or a rising wedge as a pause within a downtrend.
In both cases the reading of the breakout direction is the same as above, but the larger context changes how people interpret it. In practice, it can be difficult to know in advance which situation a wedge is.
Wedge vs. Flag vs. Triangle
| Pattern | Trendlines | Typical duration |
|---|---|---|
| Wedge | Both slope the same direction, converging | Several weeks to months |
| Flag | Parallel, sloping against the prior move | Short: days to a few weeks |
| Triangle | Opposite slopes, or one flat | Weeks to months |
The simplest test: do both lines slope the same way, and do they converge? If yes, it's a wedge.
Confirmation, Volume, and Targets
- Confirmation: a close beyond the relevant trendline (above for a falling wedge, below for a rising one). Many analysts want to see the break hold rather than reverse immediately.
- Volume: volume is often described as declining as the wedge forms and increasing on the breakout, though that is a general description, not a rule.
- Price targets: one common convention is to measure the widest part of the wedge and project that distance from the breakout point. This is a rough illustration, not a forecast.
Honest Limitations
- Wedges are subjective. Where the trendlines are drawn determines whether a wedge exists, and slightly different lines can produce a different answer. The boundaries usually have to be drawn with hindsight.
- Failures are common. A falling wedge can break down instead of up, and a rising wedge can break upward. The directional reading is a tendency, not a guarantee.
- The rising wedge in a bull market. A rising wedge during a strong uptrend can take a long time to resolve — or resolve upward — which is why a bearish reading can be early.
- Time-frame dependence. A wedge on a 5-minute chart and on a weekly chart are different things with different implications.
The Bottom Line
A wedge is a converging pattern in which both trendlines slope the same way; a falling wedge is traditionally read as bullish and a rising wedge as bearish, because the narrowing swings suggest the prevailing move is losing steam. Like all patterns, it is a description of price behavior rather than a prediction, and the confirmation that matters is what price does at the trendline.
This article is for educational purposes only and is not investment advice.
Find out what we're watching before the market opens
Every day we send a free breakdown of the signals, setups, and stocks getting institutional attention. No paid subscription. No upsell. Just the signal.
Get the Next Alert →