How Long Does a Bull Flag Last? Typical Duration and Proportions
A bull flag is a short pause, not a long base. Here's the commonly cited duration for the flag, how it relates to the pole, and what it means when a 'flag' drags on too long.
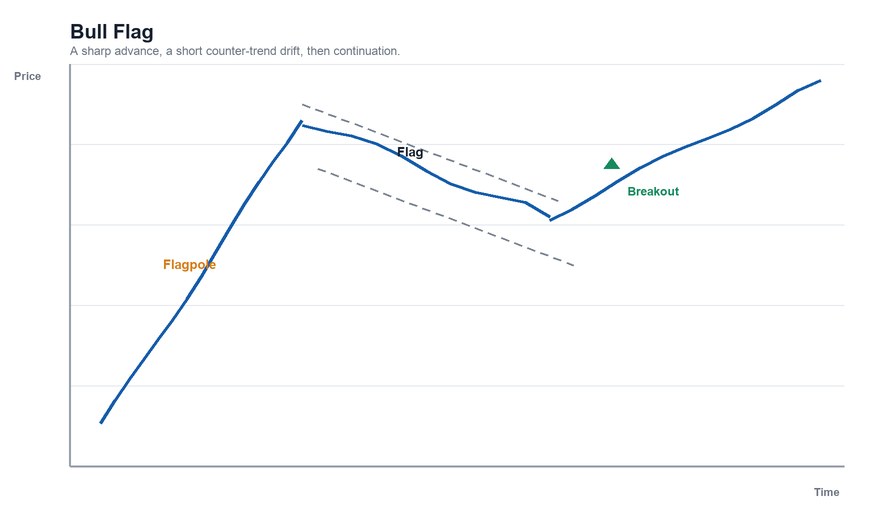
A bull flag is meant to be a brief pause inside a strong advance. The defining feature is speed: a sharp rise (the pole), then a short, shallow drift lower (the flag), then a resumption. That raises an obvious practical question: how long is "brief"?
There is no official answer, but there are commonly cited guidelines.
The Commonly Cited Range
Technical analysis textbooks and educators generally describe flags as short-term patterns, lasting from a few days to a few weeks. Many sources place the upper end at roughly three to four weeks on a daily chart.
These are guidelines drawn from chart-reading convention, not tested rules, and different authors give different ranges. What matters more than the exact number is the relationship between the parts of the pattern.
The Proportions That Matter
Flag length relative to the pole. In the classic description, the flag is much shorter than the time it took to form the pole. A pole that took two weeks of strong buying might be followed by a flag of a few days to a week. As the flag grows long relative to the pole, the pattern looks less like a pause and more like something else.
Flag depth relative to the pole. The pullback is usually described as shallow — a modest retracement of the pole, rather than giving back most of it. Textbooks often cite a fraction of the pole as a guideline. A flag that retraces most of the pole is generally not considered a flag.
Slope and shape. The flag typically drifts against the prior move (downward after an upward pole) inside roughly parallel trendlines. If the trendlines converge, it's closer to a pennant.
Volume. Volume is commonly described as being heavy during the pole, drying up during the flag, and expanding again on the breakout. See what volume confirms a breakout.
What It Means When It Drags On
The reason duration matters is that a flag is defined as a brief pause. If the consolidation stretches on far longer than the guideline range, one of several things is usually going on, and the label should change:
- It's become a different pattern. A longer sideways consolidation might be better described as a base, a rectangle, or a triangle.
- The advance has lost momentum. A long, grinding pullback after a fast move suggests the buying that created the pole has faded.
- It's become a reversal. If the pullback deepens past the flag's lower boundary and keeps going, the "flag" was just the start of a decline.
The honest version: duration is one of the main tests of whether something qualifies as a flag. A stock that has been drifting for two months after a spike is not usually discussed as a bull flag.
The Time Frame Caveat
"A few days to a few weeks" refers to a daily chart. The same shape can appear on an hourly chart, where it may last a few hours to a few days, or on a weekly chart, where it may last several weeks. What stays roughly constant is the proportion of the flag to the pole, not the absolute time.
Worked Example
A stock climbs from $40 to $50 over eight trading days (the pole). It then drifts down to $47.50 over the next five trading days inside a tight, downward-sloping channel (the flag), a retracement of 25% of the pole.
- Duration: five days vs. eight days for the pole — shorter than the pole, consistent with the guideline.
- Depth: a quarter of the pole — shallow, consistent with the guideline.
Compare a stock that spikes from $40 to $50 in eight days and then trades between $44 and $48 for ten weeks: the consolidation is longer than the pole by a wide margin, so it would normally be called a base or range rather than a flag.
Limitations
- The numbers are conventions. No study fixes the "correct" flag length, and different pattern definitions will give different durations.
- Hindsight problems. Whether a consolidation counts as a flag is usually obvious only after it resolves.
- A flag can fail. A pattern with perfect proportions can still break down. See false breakouts.
For the full pattern description, including the traditional price target, see our bull flag guide.
This article is for educational purposes only and is not investment advice.
Find out what we're watching before the market opens
Every day we send a free breakdown of the signals, setups, and stocks getting institutional attention. No paid subscription. No upsell. Just the signal.
Get the Next Alert →