Inverse Head and Shoulders Pattern: How to Identify It and How It's Read
The inverse head and shoulders is a bullish reversal pattern with three troughs, the middle one lowest. Here's how the neckline, volume, and price target work, and where the pattern fails.
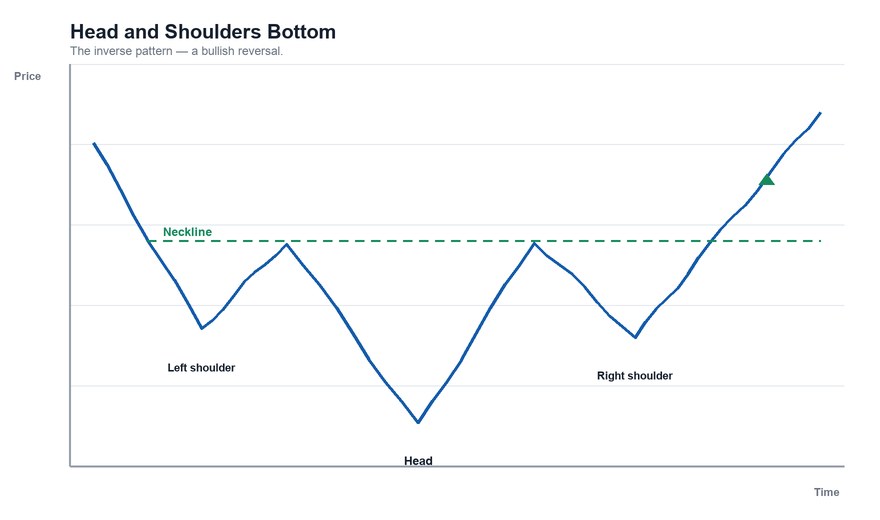
The inverse head and shoulders (also called the head and shoulders bottom) is the upside-down version of the head and shoulders top. It forms after a decline and is traditionally read as a possible bullish reversal.
The Structure
The pattern has five parts:
- Left shoulder. Price falls to a low, then rallies.
- Head. Price falls again, to a lower low than the left shoulder, then rallies.
- Right shoulder. Price falls a third time, but only to a higher low than the head, roughly similar to the left shoulder, then rallies.
- Neckline. A line drawn across the rally highs between the troughs. It can be flat or slope slightly up or down.
- Breakout. Price rises above the neckline.
The key is that the head is the lowest point and the shoulders are roughly symmetrical, though real charts are rarely exactly symmetrical.
Why It's Read as Bullish
The traditional story is about selling pressure fading. The head makes a new low, but the rally that follows is strong. Then the right shoulder fails to make a new low, which suggests sellers no longer have enough strength to push price lower. When price breaks above the neckline, buyers are seen to have taken control.
Confirmation: The Neckline Break
The pattern is not generally considered complete until price closes above the neckline. Before then, it might just be three dips. Common confirmation conditions:
- A close above the neckline, not just an intraday move.
- Volume expanding on the breakout. See what volume confirms a breakout.
- Sometimes, a retest in which price returns to the neckline and holds it as support.
Volume in the textbook case is often described as heaviest on the head's decline, lighter at the right shoulder's low, and strong on the neckline breakout.
The Traditional Price Target
The measured-move convention:
- Measure the vertical distance from the bottom of the head to the neckline.
- Project that distance upward from the neckline breakout.
Example. The head's low is $40 and the neckline is at $50 (height $10). Price breaks above the neckline at $50. The measured target is $50 + $10 = $60.
This is a convention, not a prediction. See how to measure a price target from a chart pattern.
Inverse vs. Regular Head and Shoulders
| Head and shoulders (top) | Inverse head and shoulders | |
|---|---|---|
| Appears after | An advance | A decline |
| Middle point | Highest peak | Lowest trough |
| Neckline connects | The two troughs | The two rally highs |
| Traditional reading | Bearish reversal | Bullish reversal |
| Confirmation | Close below the neckline | Close above the neckline |
How It Fails
- Never breaks the neckline. Price may rally partway and roll over, with the right shoulder becoming a lower low.
- Fakeout breakouts. A close above the neckline can quickly reverse. See false breakouts.
- A sloping neckline makes the breakout level harder to define, and slight changes in where it's drawn change the target.
- The shoulders may not be symmetrical, so whether it counts as the pattern is a judgment call.
- It forms slowly. The pattern often takes weeks to months, and is easy to identify only in hindsight.
Limits of the Evidence
Head and shoulders patterns are among the best-known, and researchers have tested them. A 2000 Journal of Finance paper by Lo, Mamaysky, and Wang, which used an algorithm to detect patterns including head and shoulders, found modest incremental information in some cases. But the effects were small and varied by period and stock group. See do chart patterns actually work.
Also consider the time frame: a pattern on a daily chart carries different weight than one on a 5-minute chart. See timeframes.
This article is for educational purposes only and is not investment advice.
Find out what we're watching before the market opens
Every day we send a free breakdown of the signals, setups, and stocks getting institutional attention. No paid subscription. No upsell. Just the signal.
Get the Next Alert →