Ascending Triangle Pattern: How to Identify It and How It's Read
An ascending triangle pairs a flat resistance line with rising lows, and is traditionally read as bullish. Here's how to identify one, what confirms it, and where it fails.
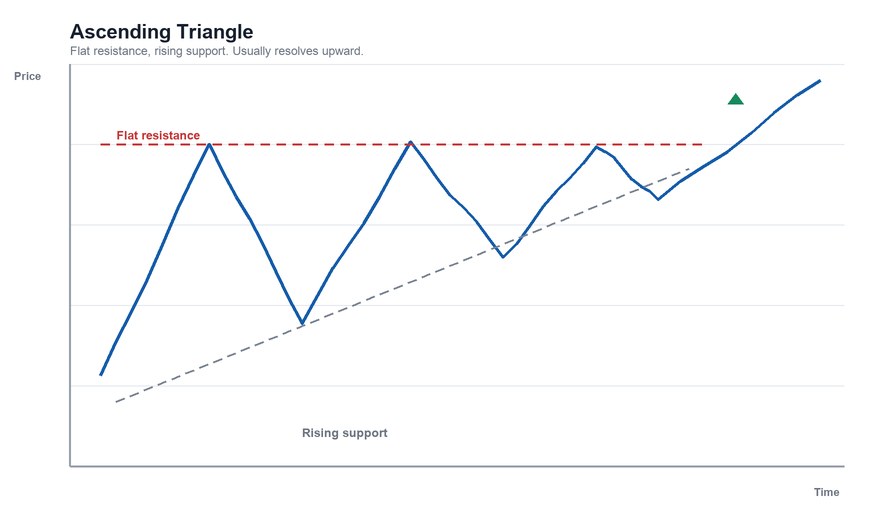
An ascending triangle is a chart pattern with a flat horizontal resistance line on top and a rising trendline of higher lows underneath. The two lines converge, squeezing price into a narrowing range. It's traditionally read as a bullish pattern.
The Structure
- Flat resistance. Price repeatedly rallies to roughly the same high and is turned back. Two or more touches are usually required to draw the line.
- Rising support. Each pullback ends at a higher low than the one before. A line connecting at least two of those lows slopes upward.
- Convergence. The two lines move toward each other, forming a triangle with a flat top.
- Breakout. Price closes above the flat resistance (the usual expectation) or below the rising support (the failure case).
It typically takes weeks to a few months on a daily chart.
Why It's Read as Bullish
The traditional story is about a changing balance of power. Sellers are consistently defending the same price, which holds the highs flat. But buyers are getting more aggressive, willing to step in at a higher price each time instead of waiting for a deeper dip. The rising lows suggest that demand is building against a fixed supply. Eventually, the pressure is expected to break the ceiling.
This is the textbook reading. It describes a tendency, not a certainty.
Volume
The commonly described profile:
- Volume contracts as the triangle narrows and the range tightens.
- Volume expands on the breakout above resistance.
A breakout on weak volume is generally viewed with more suspicion. See what volume confirms a breakout for how that's measured.
The Traditional Price Target
- Measure the height of the triangle at its widest point, usually at the start, between the flat top and the first low.
- Project that distance upward from the breakout.
Example. Resistance is at $50. The first low was $42 (height $8). Price breaks above $50. Measured target: $50 + $8 = $58.
It's a convention, not a forecast. See how to measure a price target.
Where It Fails
- It breaks down. Despite the bullish lean, price can break below the rising support line instead, and that break becomes the signal.
- Fakeouts. A close above resistance can quickly reverse. See false breakouts.
- Subjective lines. Slightly different anchor points produce different triangles.
- Late breakout. If price drifts near the apex without breaking out, the pattern loses significance, and breakouts closer to the apex are often described as less reliable.
- Resistance that finally gives way can still be followed by a pullback to the old resistance.
Ascending vs. Other Triangles
| Triangle | Top | Bottom | Traditional lean |
|---|---|---|---|
| Ascending | Flat | Rising | Bullish |
| Descending | Falling | Flat | Bearish |
| Symmetrical | Falling | Rising | Follows prior trend |
The full comparison, including symmetrical triangles, is in our triangle patterns guide. Ascending triangles can also appear as continuation patterns within an uptrend; see continuation patterns.
For the research on whether patterns predict anything, see do chart patterns actually work.
This article is for educational purposes only and is not investment advice.
Find out what we're watching before the market opens
Every day we send a free breakdown of the signals, setups, and stocks getting institutional attention. No paid subscription. No upsell. Just the signal.
Get the Next Alert →