Stochastic Oscillator Explained: Formula, Settings, and How to Read It
The stochastic oscillator measures where a close sits inside its recent high-low range, on a scale of 0 to 100. Here's the formula, the standard settings, and where the indicator misleads.
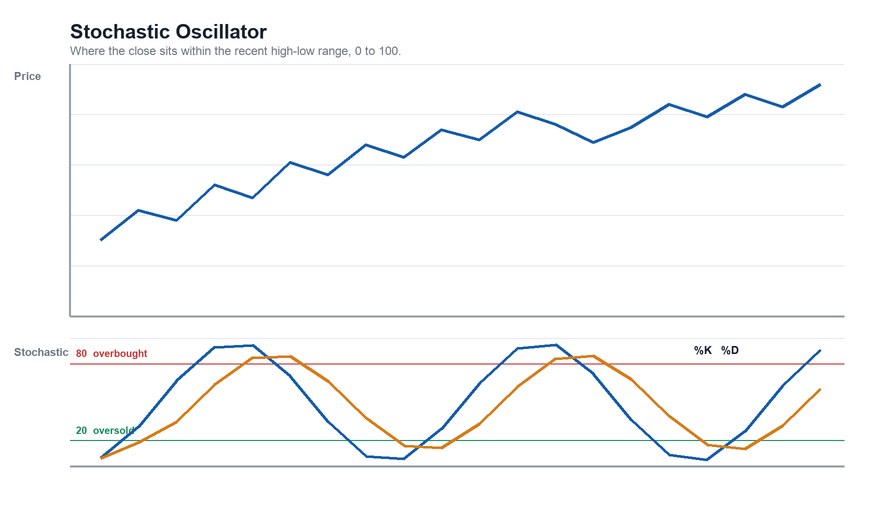
The stochastic oscillator is a momentum indicator that answers one narrow question: where did the price close, relative to the range it has traded in recently? If a stock closes at the very top of its recent range, the reading is near 100. If it closes at the very bottom, the reading is near 0. Everything else the indicator does is built on that single measurement.
It was developed by George Lane in the late 1950s, and it remains a default option on almost every charting platform.
The Formula
The raw stochastic value, called %K, is calculated like this:
%K = (Close − Lowest Low over the last N periods) ÷ (Highest High over the last N periods − Lowest Low over the last N periods) × 100
With the most common setting of N = 14, a stock that has traded between $40 and $50 over the last 14 periods and closes at $47 has a %K of (47 − 40) ÷ (50 − 40) × 100 = 70. It closed 70% of the way up its recent range.
A second line, %D, is a moving average of %K — conventionally a 3-period simple moving average. Because %D is smoother, it lags %K. The two lines crossing is the indicator's most common signal.
Fast, Slow, and Full Stochastics
You will see three variants, and they differ only in how much smoothing is applied:
- Fast stochastic: the raw %K described above, with a 3-period average as %D. It is jumpy.
- Slow stochastic: the raw %K is first smoothed with a 3-period average, and that smoothed line becomes the new %K. %D is a further 3-period average of it. This is the version most platforms show by default (often written 14, 3, 3).
- Full stochastic: lets you choose every smoothing length yourself.
If two charts show "the stochastic" with different-looking lines, the usual explanation is that one is fast and the other is slow.
The 80 and 20 Levels
Conventionally, readings above 80 are labeled "overbought" and readings below 20 are labeled "oversold." These labels are descriptive, not predictive. A reading above 80 means only that the stock has been closing near the top of its recent range. It does not say the price must fall.
Common Ways the Indicator Is Read
- Overbought and oversold exits. Some traders pay attention when %K crosses back below 80 or back above 20, treating the exit from an extreme as more meaningful than being in it.
- %K and %D crossovers. %K crossing above %D is read as momentum turning up; crossing below as momentum turning down. Crossovers are more commonly watched when they happen near the extremes.
- Divergence. If price makes a new high but the stochastic makes a lower high, momentum is not confirming the move. This is the reading most often described as an early warning, and also one of the easiest to over-interpret.
Where the Stochastic Misleads
Strong trends. In a persistent uptrend, a stock can close near the top of its range day after day, so the stochastic can sit above 80 for a long time while the price keeps climbing. Treating "overbought" as a sell signal in that setting means repeatedly being early. The mirror image applies to oversold readings in downtrends.
Choppy markets suit it best. The indicator was designed around range-bound price action, where closes naturally swing between the top and bottom of the range. In trends, its signals tend to be more numerous and less reliable.
It is a measurement of position, not value. The stochastic knows nothing about earnings, valuation, or news. It simply restates recent price action in a normalized form.
It is sensitive to the lookback. A shorter N produces more crossovers and more false alarms; a longer N produces fewer signals that arrive later. There is no universally correct setting.
How It Differs From Other Indicators
The stochastic looks at where the close falls inside a range. The Relative Strength Index (RSI) looks at the size of recent gains relative to losses. They often agree, but they can diverge, because they are measuring different things. For trend direction rather than momentum, the Aroon indicator is built differently again: it counts how long ago the highs and lows occurred.
The Bottom Line
The stochastic oscillator turns "how close to the top or bottom of its range did this stock close?" into a number between 0 and 100. That is useful context, particularly in sideways markets. It is a description of recent price behavior, not a forecast — and like every indicator, it is best read alongside the broader trend and the support and resistance levels on the price chart.
This article is for educational purposes only and is not investment advice.
Find out what we're watching before the market opens
Every day we send a free breakdown of the signals, setups, and stocks getting institutional attention. No paid subscription. No upsell. Just the signal.
Get the Next Alert →