Aroon Indicator Explained: How Aroon Up and Aroon Down Work
The Aroon indicator doesn't measure how far price moved. It counts how long ago the most recent high and low occurred. Here's the formula and how to read it.
Most indicators ask how far or how fast price has moved. The Aroon indicator asks something different: how recently did the stock set its latest high, and how recently did it set its latest low? The answer, it turns out, says a lot about whether a trend is in place.
Aroon was introduced by Tushar Chande in 1995. The name comes from a Sanskrit word often translated as "dawn's early light," a nod to the idea of spotting a trend's start.
The Formula
Aroon is two lines, both measured on a 0–100 scale over a lookback of N periods (25 is the common default):
- Aroon Up = ((N − periods since the highest high) ÷ N) × 100
- Aroon Down = ((N − periods since the lowest low) ÷ N) × 100
If today's close set a new N-period high, "periods since the highest high" is 0 and Aroon Up is 100. If the highest high was N periods ago, Aroon Up is 0. The same logic applies to Aroon Down and the lowest low.
So Aroon Up near 100 means the stock made a recent high; near 0 means its highs are old. It only tracks timing, not the size of the move.
Reading the Two Lines
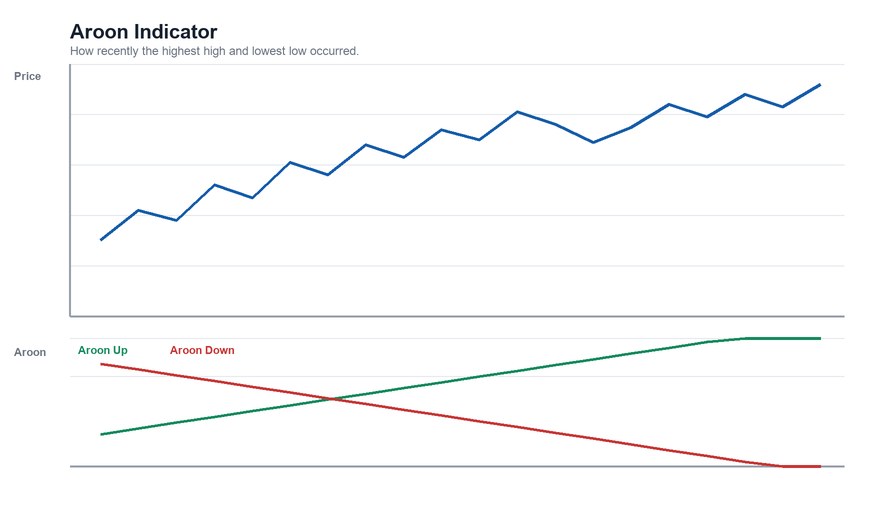
- Aroon Up high, Aroon Down low (for example, Up above 70 and Down below 30): highs are recent and lows are old. That is the pattern of an uptrend.
- Aroon Down high, Aroon Up low: the reverse — a downtrend pattern.
- Both lines low or drifting in the middle: neither recent highs nor lows are being set. That is the pattern of a consolidating, trendless market.
- Crossovers: when Aroon Up crosses above Aroon Down, recent highs are now fresher than recent lows, and the indicator is flagging a possible shift toward an uptrend. The opposite crossover flags a shift toward a downtrend.
The 70 and 30 thresholds are conventions, not rules.
The Aroon Oscillator
Subtracting the two lines gives the Aroon Oscillator (Aroon Up − Aroon Down), which ranges from −100 to +100. Positive readings mean upward bias, negative readings mean downward bias, and values near zero suggest no clear trend. Some people prefer it because it condenses the two lines into one.
A Worked Example
Suppose a stock has a 25-period Aroon Up of 96 and an Aroon Down of 12. A reading of 96 means the highest high in the last 25 periods happened only one period ago (25 − 1 = 24; 24 ÷ 25 × 100 = 96). An Aroon Down of 12 means the lowest low was 22 periods ago. Highs are fresh and lows are stale — the profile of an uptrend.
Where Aroon Falls Short
It ignores magnitude. A stock that makes a new high by one cent and a stock that makes a new high by 10% register identically. A "strong" Aroon reading does not mean a strong move.
It lags and it whipsaws. Because it depends on a lookback window, a trend change registers only after the window shifts. In a sideways market with frequent small new highs and lows, the two lines cross often, producing false signals.
The lookback matters. A shorter period reacts faster and gives more false alarms; a longer one is steadier but later.
It is a trend detector, not a predictor. Aroon describes what has happened over the lookback window. It says nothing about what happens next.
How It Compares
The stochastic oscillator measures where the close sits in the range; Aroon measures how long ago the extremes happened. A stock can have a high stochastic reading with a low Aroon Up (closing near the top of a range whose high was set a while back), which is one reason traders sometimes look at both. For trend context on the chart itself, see the discussion of trends and support and resistance.
The Bottom Line
Aroon turns the age of the latest high and low into a trend gauge. Used on its own it is a quick way to see whether a stock is trending or drifting, with the usual caveats: it describes the past, it does not weigh the size of moves, and it works worst in choppy markets.
This article is for educational purposes only and is not investment advice.
Find out what we're watching before the market opens
Every day we send a free breakdown of the signals, setups, and stocks getting institutional attention. No paid subscription. No upsell. Just the signal.
Get the Next Alert →