Linear vs. Logarithmic Price Scale: What's the Difference and When to Use Each
A linear chart spaces prices by dollars; a logarithmic chart spaces them by percentage. The same stock can look very different on each. Here's why and when it matters.
Every price chart has a vertical axis, and that axis can be drawn in two ways. On a linear (arithmetic) scale, equal vertical distances represent equal dollar changes. On a logarithmic scale, equal vertical distances represent equal percentage changes. The difference is invisible on a short chart and dramatic on a long one.
Linear Scale: Equal Dollars
On a linear scale, the gap between $10 and $20 is the same height as the gap between $20 and $30, and between $90 and $100. Each $10 move takes up the same space.
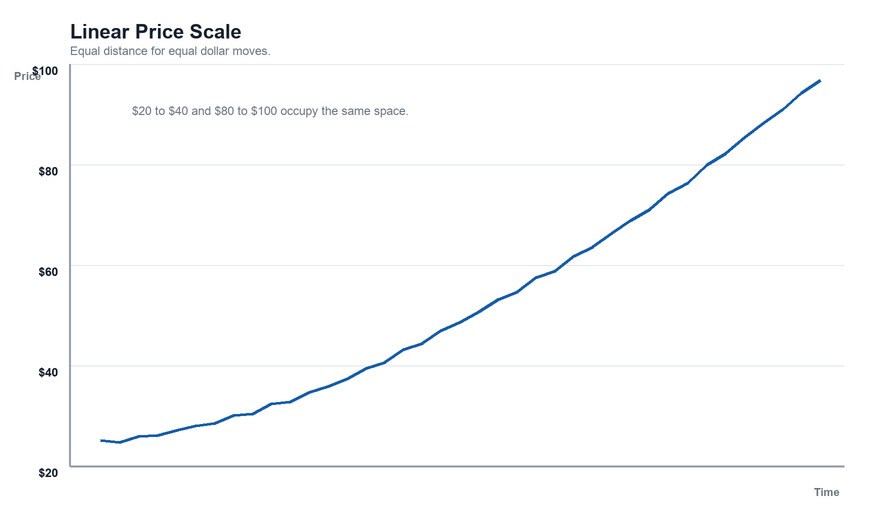
That sounds natural, but it creates a distortion over time. A stock going from $10 to $20 gained 100%. A stock going from $90 to $100 gained about 11%. On a linear chart, both are drawn as the same $10-tall move. The 11% gain looks as impressive as the 100% gain.
Logarithmic Scale: Equal Percentages
On a log scale, the distance from $10 to $20 (a 100% gain) equals the distance from $20 to $40 (also 100%) and from $40 to $80. A move from $90 to $100 (about 11%) takes up far less room than $10 to $20.
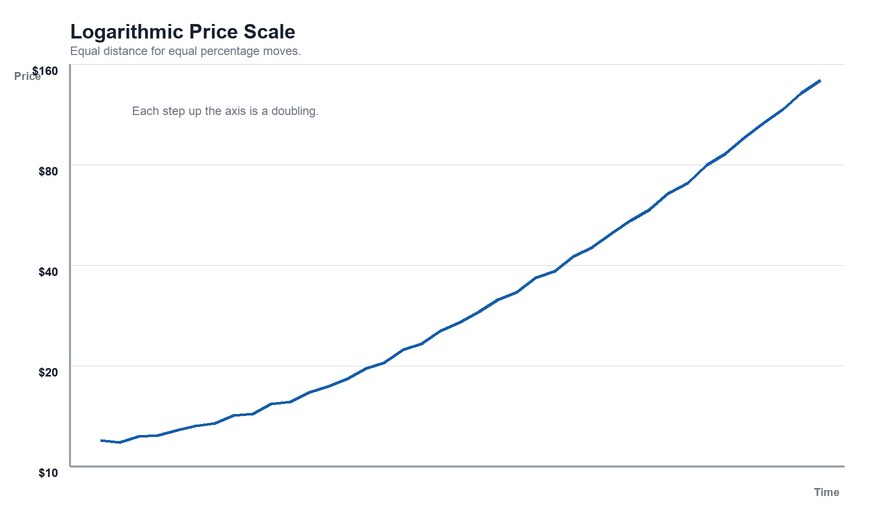
The practical effect: on a log chart, a steady percentage growth rate draws as a straight line. On a linear chart, the same steady growth rate draws as an ever-steepening curve.
A Quick Example
A stock compounds at a steady 10% per year for 30 years, starting at $10. It ends near $175.
- On a linear chart, the line looks flat for years and then rockets upward at the end, even though the growth rate never changed.
- On a log chart, the line is straight, accurately showing a constant rate of growth.
When Each Scale Is Used
Linear scale tends to work well for:
- short time frames (days to a few months), where price barely changes in relative terms
- stocks that trade in a narrow range
- situations where the dollar amount of a move is what matters
Logarithmic scale tends to work well for:
- long time frames (years or decades)
- stocks or indexes that have changed in price by a large multiple
- comparing the size of moves at very different price levels
Most charting platforms offer a toggle, and the default is usually linear.
Why It Matters for Chart Patterns and Trendlines
Trendlines and patterns can change shape depending on the scale. A trendline that touches several lows on a linear chart may not line up on a log chart, and vice versa. Over short windows, the difference is negligible. Over multi-year windows — where chart patterns like a cup and handle can stretch for months — checking both views can prevent drawing a line that only works on one scale.
Horizontal support and resistance levels are unaffected by the choice, since they are fixed prices.
Honest Caveats
- Neither scale is "correct." They show the same data, emphasizing different things.
- Log scales are less intuitive. The uneven spacing of dollar gridlines surprises many people.
- Comparisons between charts require the same scale. Comparing a log chart of one stock to a linear chart of another can mislead.
The Bottom Line
Use a linear scale to see dollar moves over short periods; use a logarithmic scale to see percentage moves over long ones. If a long-term chart looks like a stock has exploded upward late in its life, check whether the chart is linear before concluding that growth accelerated.
This article is for educational purposes only and is not investment advice.
Find out what we're watching before the market opens
Every day we send a free breakdown of the signals, setups, and stocks getting institutional attention. No paid subscription. No upsell. Just the signal.
Get the Next Alert →