Point and Figure Charts Explained: X's, O's, Box Size, and Reversals
Point and figure charts ignore time entirely and plot only price changes of a chosen size, using columns of X's and O's. Here's how they're built and read.
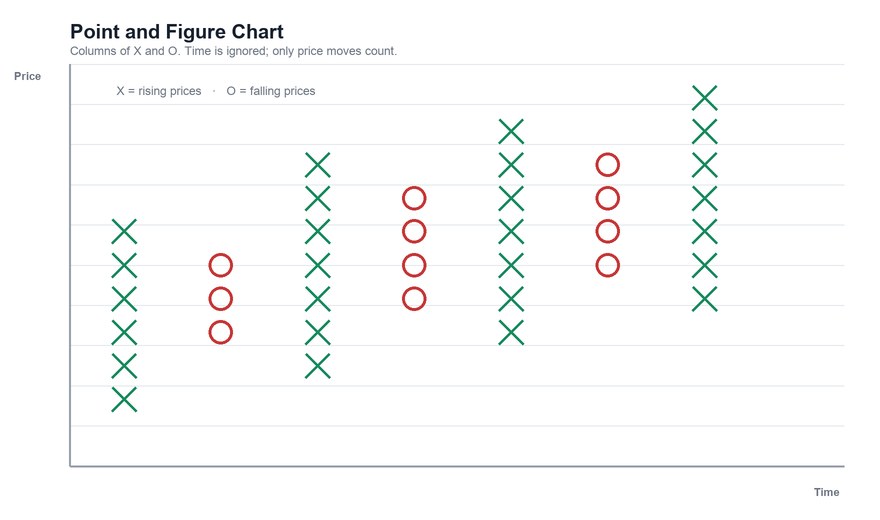
A point and figure chart looks nothing like a line or candlestick chart. It is a grid of X's and O's, and it has no time axis at all. Point and figure charting is one of the oldest charting methods still in use, with roots in the late 1800s, and it is built on a different premise: only price changes of meaningful size matter, and the passage of time does not.
The Building Blocks
- X's represent rising prices. Each X is a box stacked on top of the previous one as price climbs.
- O's represent falling prices. Each O is stacked downward as price drops.
- Box size is the price amount each box represents, such as $1 per box. You choose it (or the platform chooses it based on the stock's price).
- Reversal amount is the number of boxes price must move in the opposite direction before the chart switches to a new column. The most common setting is three boxes, often written "3-box reversal."
How a Chart Gets Drawn
Say the box size is $1 and the reversal is 3 boxes. A stock is at $50 and rises to $54: the chart shows a column of X's from $50 to $54. Then:
- If the price falls to $53 or $52, nothing is drawn — the pullback is smaller than three boxes.
- If it falls to $51 (three boxes below $54), the chart shifts one column to the right and draws a column of O's starting below the top X.
- If instead it rises to $55, an X is simply added to the existing column.
Time plays no role. A column can represent a single day or several months. If nothing changes by a full box, nothing is added.
What This Filters Out
The design deliberately ignores:
- Time. Slow, quiet periods and fast, volatile ones are compressed into the same format.
- Small moves. Fluctuations smaller than the box size or reversal amount never appear. Many traders like point and figure charts for exactly this reason: the clutter disappears.
- Volume (in the basic form).
What's left is a clean picture of supply and demand shifting at specific price levels.
How the Charts Are Read
Point and figure charting uses its own pattern vocabulary:
- Double top breakout: an X column rises above the top of the previous X column.
- Double bottom breakdown: an O column falls below the bottom of the previous O column.
- Support and resistance show up as price levels where several columns turn around. These horizontal levels work like the support and resistance levels on traditional charts.
- Trend lines are drawn at 45 degrees in the classic approach because each box is square.
- Price objectives are sometimes estimated by counting the boxes in a base or consolidation and projecting that distance. Treat these as rough illustrations, not forecasts.
Common chart patterns such as triangles and flags also appear on point and figure charts, drawn with X's and O's rather than lines.
Honest Limitations
The settings change the picture. A smaller box size or reversal makes the chart busier and more sensitive; a larger one makes it calmer and slower. Two analysts using different settings can reach different conclusions from the same stock.
Time matters to many investors. Because there's no time axis, it's harder to tell when something happened or how long a pattern took.
It is less common. Most free charting platforms emphasize candlestick and line charts; point and figure is available on some but is not a default.
Signals are descriptive, not predictive. As with any chart type, a breakout on a point and figure chart shows that price moved; it does not guarantee what comes next.
The Bottom Line
Point and figure charts trade detail for clarity: by recording only price moves of a set size and ignoring time, they reveal where buyers and sellers have repeatedly turned the price around. They're worth understanding even if you never use them, because they show how much a chart's appearance depends on what the chart chooses to leave out.
This article is for educational purposes only and is not investment advice.
Find out what we're watching before the market opens
Every day we send a free breakdown of the signals, setups, and stocks getting institutional attention. No paid subscription. No upsell. Just the signal.
Get the Next Alert →