Line vs. Bar vs. Candlestick Charts: What Each One Shows (and Hides)
Line, bar, and candlestick charts are drawn from the same price data but show different amounts of it. Here's what each one includes, what it leaves out, and when each is useful.
The three most common stock chart types are all drawn from the same underlying price data. What differs is how much of that data each one shows. A line chart shows one number per period. A bar or candlestick chart shows four.
The four numbers are the open, high, low, and close (OHLC) for each period, whether that period is a minute, a day, or a week.
Line Charts: One Number Per Period
A line chart connects the closing price of each period with a continuous line.
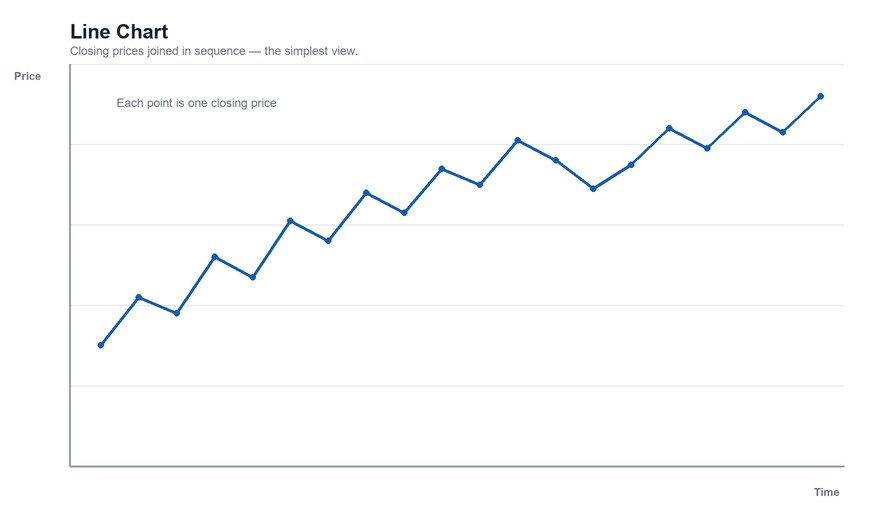
What it shows well: the overall direction of the trend with the least visual clutter. It's the easiest chart to read at a glance and is commonly used for long time frames or for comparing several securities on one chart.
What it hides: everything that happened during each period. A day that opened at $50, spiked to $58, dropped to $47, and closed at $52 looks identical to a day that traded quietly between $51 and $52 and closed at $52.
Bar Charts (OHLC): Four Numbers as a Vertical Line
On an OHLC bar chart, each period is a vertical bar running from the period's low to its high. A small tick on the left marks the open; a tick on the right marks the close.
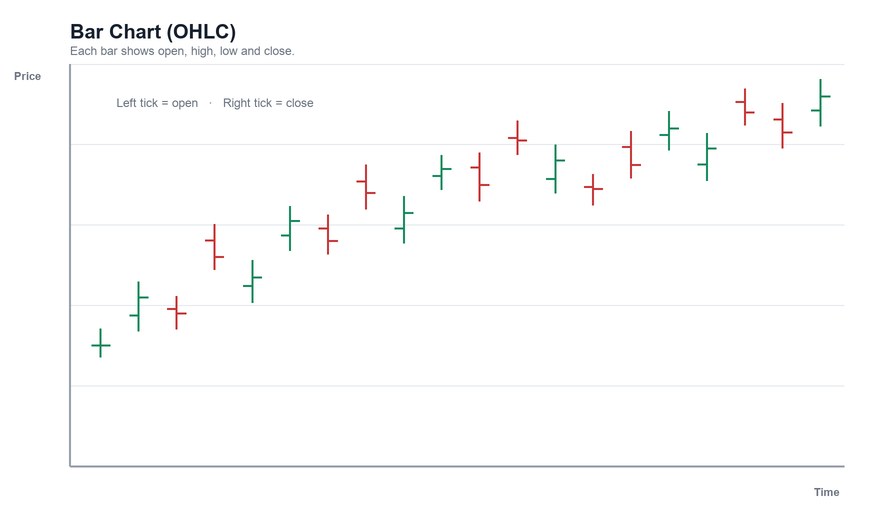
What it shows well: the full range of each period, plus whether the close finished above or below the open. The length of the bar shows how volatile the period was.
What's harder: judging the open-to-close relationship at a glance. You have to compare the positions of two small ticks, and on a busy chart they can be hard to see.
Candlestick Charts: Four Numbers as a Colored Body
A candlestick shows the same four values, but draws a body between the open and the close and thin wicks (or shadows) extending to the high and the low. The body is typically colored by direction: one color when the close is above the open, another when it's below.
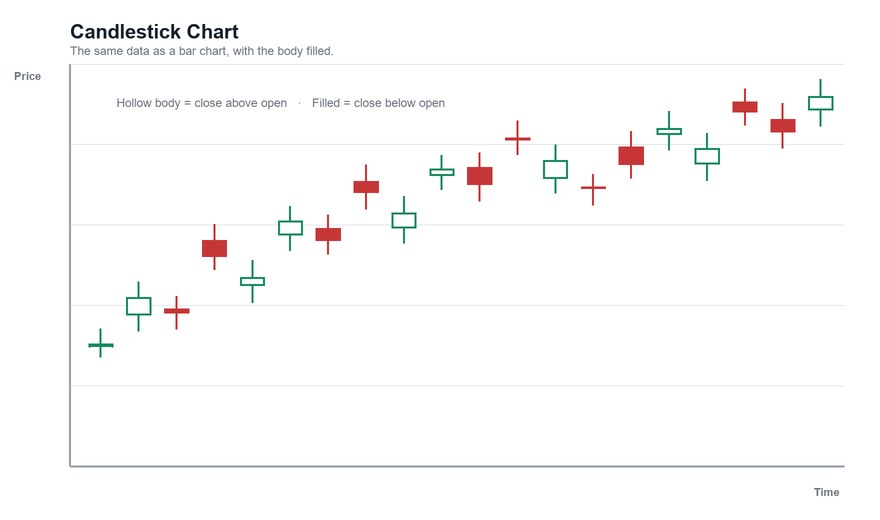
What it shows well: the same information as a bar chart, but the open-to-close relationship is much easier to see because it's a filled shape. That is why candlesticks are the default on most modern platforms.
Where they come from: candlestick charting is traditionally traced to Japanese rice traders, and was introduced to many Western traders in the early 1990s through Steve Nison's writing. The exact early history is debated, so treat the origin story as tradition rather than established fact.
Pattern vocabulary: candlesticks carry a large named-pattern vocabulary — see our candlestick pattern glossary — though how reliably those patterns predict anything is a separate and contested question.
Side by Side
| Line | OHLC bar | Candlestick | |
|---|---|---|---|
| Data plotted | Close only | Open, high, low, close | Open, high, low, close |
| Shows intraperiod range | No | Yes | Yes |
| Open-to-close visibility | None | Small ticks | Prominent body |
| Visual clutter | Lowest | Moderate | Moderate |
| Typical use | Long-term trend, comparisons | Range and volatility | Short-term price action, patterns |
Choosing One
- Long-term trend or multi-asset comparison: a line chart's simplicity is an advantage.
- Studying the price action of individual periods: candlesticks or OHLC bars, with candlesticks the common preference.
- Chart patterns and support/resistance: all three work. Patterns such as the cup and handle are often drawn on line charts of closing prices; many traders prefer candlesticks to see how price behaved at key levels.
One more consideration: because a line chart uses only closing prices, a level may look like support on a line chart but be briefly breached on a candlestick chart by an intraday wick. Neither is "wrong" — they're answering slightly different questions.
The Bottom Line
All three chart types describe the same prices. The line chart simplifies, the bar chart is compact, and the candlestick makes the open-to-close story visible. Choose based on what question you're asking, and remember that no chart type adds information that isn't already in the open, high, low, and close. For a broader walkthrough, see our guide to reading stock charts.
This article is for educational purposes only and is not investment advice.
Find out what we're watching before the market opens
Every day we send a free breakdown of the signals, setups, and stocks getting institutional attention. No paid subscription. No upsell. Just the signal.
Get the Next Alert →