Doji Candle Explained: Types, What It Signals, and Its Limits
A doji forms when a stock opens and closes at nearly the same price, leaving a tiny body. Here are the main types — standard, long-legged, dragonfly, gravestone — and why a doji alone doesn't predict a reversal.
A doji is a candlestick in which the open and close are virtually the same, so the body is a thin line or tiny sliver. What remains is the wicks (also called shadows), which show how far price traveled in each direction during the period before returning to roughly where it started.
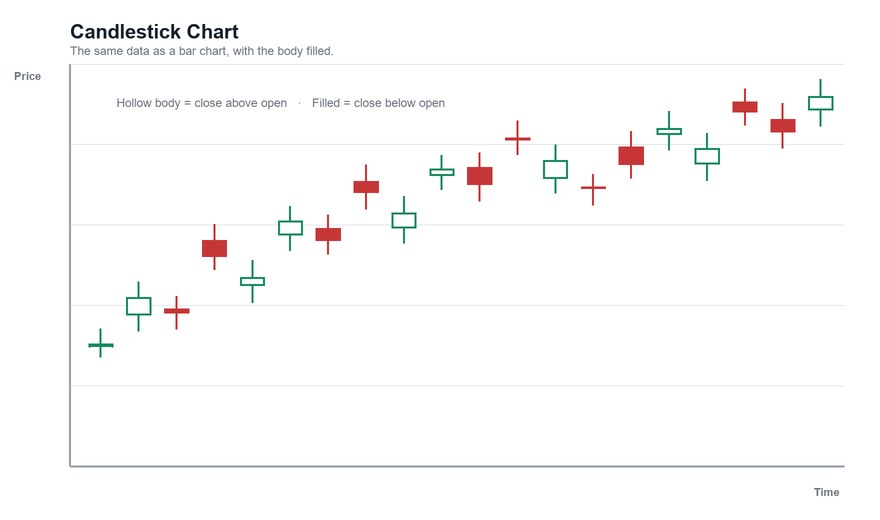
What a Doji Represents
In a normal candle, the body shows who ended the period in control: a tall green body means buyers pushed the close well above the open. A doji says that neither side won the period. Price may have moved up and down, but it ended roughly where it began.
That is why a doji is described as a sign of indecision. It is a description of the period, not a forecast.
The Main Types
Standard doji. Upper and lower wicks of roughly similar length, with a tiny body in the middle, looking like a plus sign or cross.
Long-legged doji. Very long upper and lower wicks. Price swung widely in both directions before closing near the open, which suggests a high-volatility period of contested control.
Dragonfly doji. A long lower wick and little or no upper wick, with the open and close at the top of the range. Sellers pushed price down, but buyers brought it all the way back. It looks like a "T."
Gravestone doji. A long upper wick and little or no lower wick, with the open and close at the bottom of the range. Buyers pushed price up, but sellers brought it all the way back. It looks like an upside-down "T."
Four-price doji. A rare flat line where open, high, low, and close are all the same, usually in very illiquid trading.
How a Doji Is Traditionally Read
The traditional interpretations, based on context:
- After a strong uptrend: the pause in momentum may be read as a possible sign that buying is losing steam. A gravestone doji after an advance is often read as bearish.
- After a strong downtrend: the pause may be read as a possible sign that selling is fading. A dragonfly doji after a decline is often read as bullish.
- In a sideways range: a doji often means very little.
The traditional rule is that a doji is not a signal by itself; it should be followed by a confirming candle. For example, if a doji appears after an uptrend, traders may wait for the next candle to close lower before treating it as a potential reversal.
What Counts as "Almost the Same"
There's no exact threshold. Common definitions say the open and close are within a very small fraction of the day's range, or a few cents on a typical stock. Different charting platforms and books use different tolerances, and some doji-detection tools are more lenient than others. The label is a judgment call at the edges.
A Worked Example
Say a stock opens at $50.00, trades as high as $51.20 and as low as $48.90, and closes at $50.05. The body is $0.05 on a $2.30 range. That's a long-legged doji: price moved a long way in both directions and finished almost where it started.
What the Evidence Says About Candlestick Patterns
Candlestick patterns are popular, but the research is not strongly supportive. A well-known 2006 study by Marshall, Young, and Rose in the Journal of Banking & Finance tested candlestick strategies on Dow Jones stocks and found little evidence that they produced a reliable profit. Other studies report mixed results that depend on the market and period. See do chart patterns actually work for the broader discussion.
Limits
- A doji is common. It appears often, so most dojis are followed by nothing notable.
- Context is everything. The same shape means different things after different preceding price action.
- Time frame matters. A doji on a 5-minute chart is a small event; on a weekly chart it describes a whole week. See timeframes.
- It doesn't say what happens next. Even the traditional bullish and bearish dojis require confirmation and can fail.
For other candlestick patterns, see the candlestick pattern glossary, and for how candles compare to other chart types, line vs. bar vs. candlestick charts.
This article is for educational purposes only and is not investment advice.
Find out what we're watching before the market opens
Every day we send a free breakdown of the signals, setups, and stocks getting institutional attention. No paid subscription. No upsell. Just the signal.
Get the Next Alert →